
Product

1. Definition
Light intensity distribution refers to the intensity distribution of light emitted by a light source in space. It can record information such as the luminous flux, light quantity, power, power factor, light source size, light source efficiency, and light source manufacturer and type. However, its core lies in recording the light intensity distribution of the light source in all directions.
2. Classification of distribution curves
According to the symmetry properties, light intensity distribution curves can generally be divided into three types: axisymmetric, symmetric, and asymmetric.
a) Axisymmetric: also known as rotational symmetry, which means that the light intensity distribution curves in all directions show basic symmetry, usually applicable to tubular lamps and outdoor lamps.
b) Symmetric: When the light intensity distribution of the lamp in the C0° and C180° sections is symmetrical, and the light intensity distribution of the C90° and C270° sections is also symmetrical, such a light intensity distribution curve is called a symmetrical light intensity distribution.
c) Asymmetric: refers to the asymmetry of the light intensity distribution in the C0° and C180° and C90° and C270° sections.
The light intensity distribution curve can also be divided into narrow beam, wide beam, secondary beam and other types according to the beam angle.
Narrow beam: beam angle is less than 20°.
Secondary beam: beam angle is between 20° and 40°.
Wide beam: beam angle is greater than 40°.
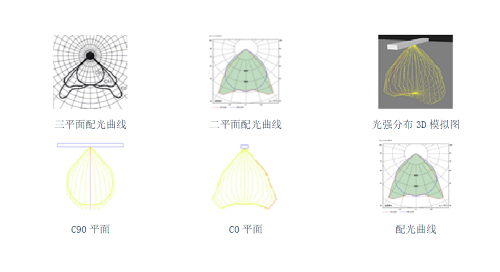
The light intensity of any lamp is different in different spaces, and we can record the distribution of light intensity in space through data or graphs. Usually, we use y coordinates to represent the light intensity distribution, with the origin of the coordinate as the center, mark the light intensity in different spaces with vectors, and then connect the end points of the vectors to form a light intensity distribution curve. Since the shape of most lamps is an axisymmetric rotation entity, its light intensity distribution in space is also axisymmetric. Therefore, it is sufficient to take a point on the axis of the lamp on any surface and use this light intensity distribution curve to represent the light intensity distribution of the entire space.
If the light intensity distribution in space is asymmetric, such as a linear fluorescent lamp, we need to use multiple light intensity distribution curves on different surfaces to describe the spatial light distribution. Take the long axis of the lamp and the vertical center surface as the C0 plane, and represent it through the C90 plane perpendicular to the C0 plane at the center of the lamp. To use C0 and C90, at least two light intensity distribution curves on the plane are required to represent the asymmetric light distribution of the lamp.
3. Understanding the light intensity distribution curve
In order to compare the light distribution characteristics of various lighting fixtures, a virtual light source with a uniform luminous flux of 1000 lumens (lm) is assumed to provide light intensity distribution data. Therefore, the actual light intensity should be the metering data obtained by multiplying the light intensity value by the ratio of the actual luminous flux to 1000. The light intensity distribution of the lamp is achieved by controlling the light through the reflector of the lamp, without using opaque prisms, gratings or diffusers to control the light. The reflector is the basic light control part of the lamp, and the higher its reflectivity, the stronger the regular reflection.